Pipeline Generation Tactics

Tracking key metrics pipeline growth is how successful B2B sales teams understand where deals move, why slow sales happen, and how to improve win rates.
At Hyperke, we’ve seen that when sales leaders and sales reps pay attention to pipeline data in real time, they make better decisions, improve lead quality, and increase total closed deals. Watching metrics like deal size, sales velocity, and conversion rates helps build a strong sales funnel and drive revenue growth.
If you want to improve your sales process and build a strong pipeline, keep reading to learn how.
Key Takeaways
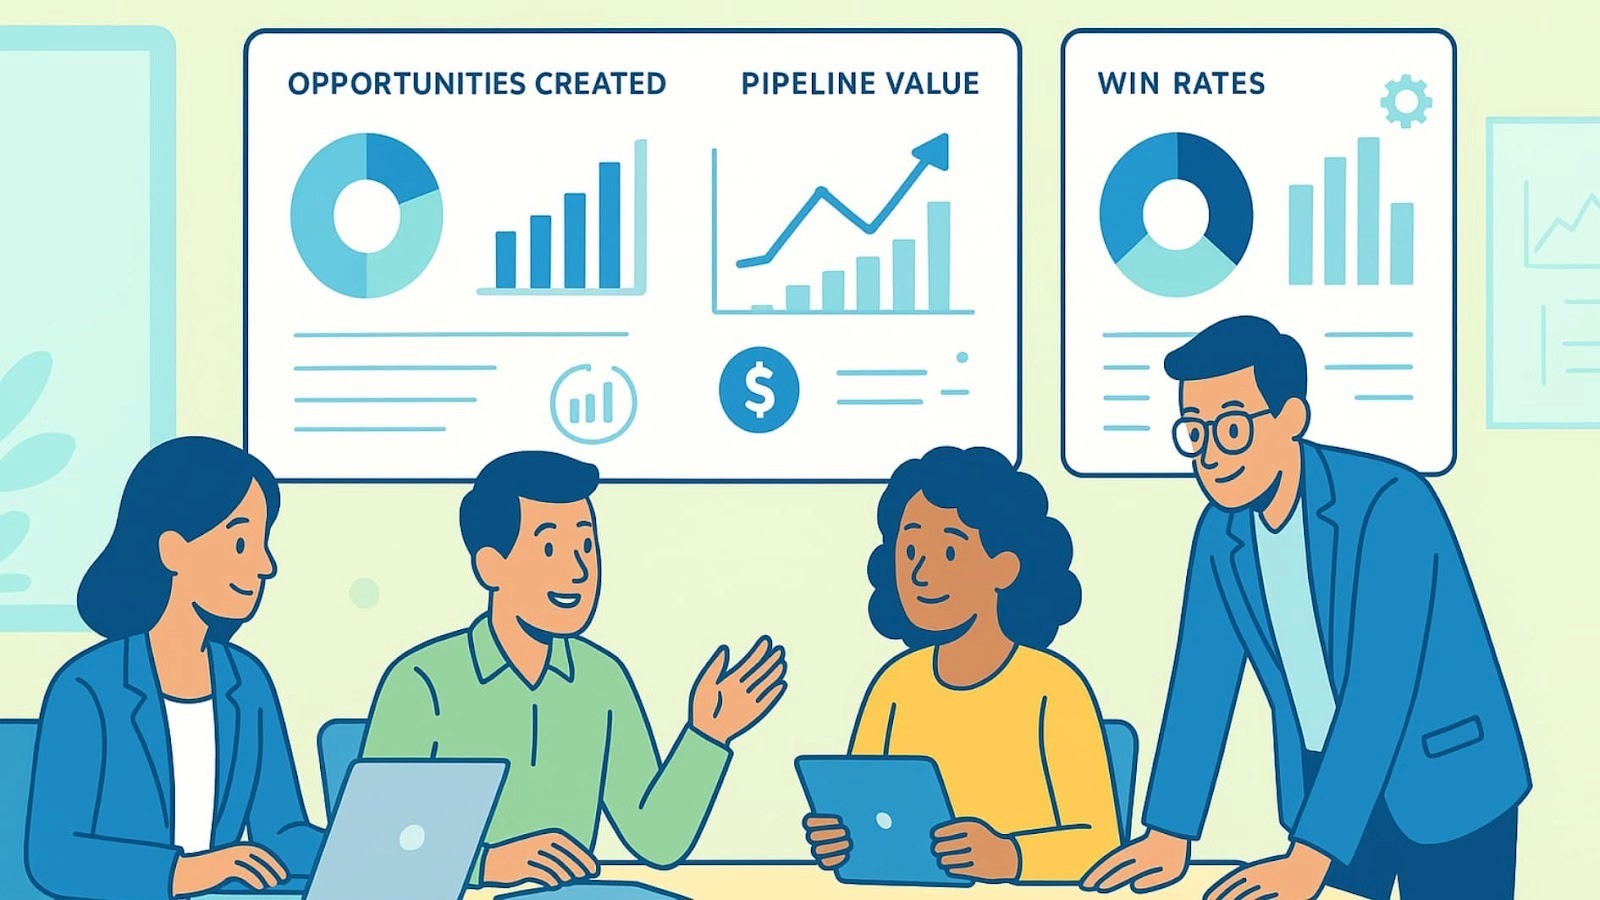
Tracking opportunities created and pipeline value gives a clear picture of pipeline health and future revenue.
Win rate and sales pipeline velocity reveal how fast deals move and the effectiveness of your sales reps.
Managing stalled deals and keeping a solid pipeline coverage ratio prevents slow sales and lost deals.
The Pipeline Growth Challenge: Why Metrics Matter
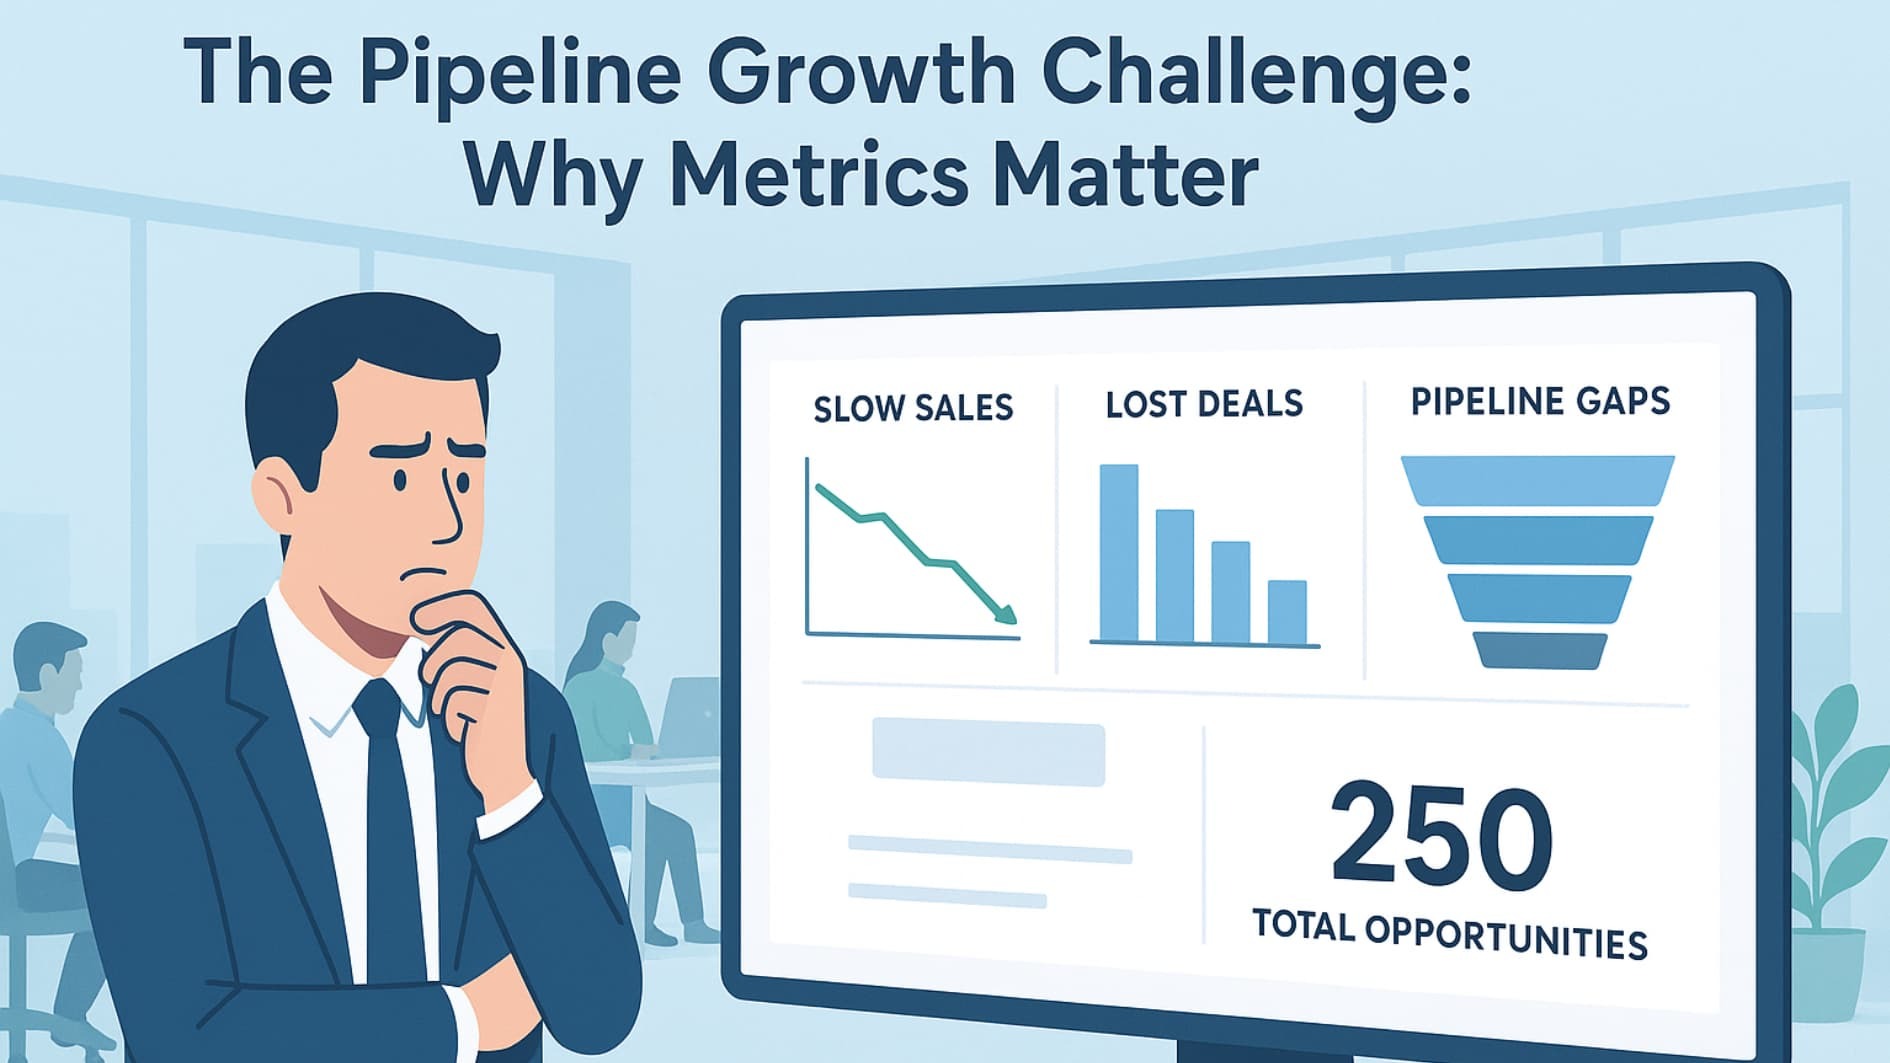
Getting deals closed ain't easy these days. Our sales team at Hyperke watches many sales leaders hitting walls with slow sales and messy pipeline health. When we don't track key metrics in real time, it's near impossible to figure out why deals move slow or why win rates drop. Most B2B sales organizations face pipeline growth problems because they're not watching their performance indicators close enough.
Think about it, when you're missing pipeline data, your sales forecasting turns into a guessing game. Marketing teams and sales reps end up working against each other instead of together on lead quality and conversion rates.
We've learned to pay attention to how our pipeline growth and sales funnel help or hurt our sales efforts. Sales reps need solid numbers from their CRM software and pipeline analytics to speed up sales velocity and close deals faster.
From what we've seen at Hyperke, sales teams who keep tabs on pipeline growth metrics (like number of opportunities and win rate) crush their goals more often. When sales leaders stay on top of these key indicators, they spot problems quick, cut down their churn rate, and set themselves up for better future sales.
Remember, without tracking these numbers, you're basically flying blind. Our team's been there, and we've learned the hard way that metrics aren't just numbers, they're your roadmap to steady growth.
Core Pipeline Growth Metrics: Track, Analyze, and Optimize
1. Opportunities Created: Fueling the Funnel
Opportunities created refers to the total number of new deals or sales qualified leads added to the sales funnel in a given time. This metric helps measure lead generation success and sales pipeline health.
We’ve seen that a steady flow of qualified leads is critical. If the total number of opportunities drops, it might signal problems in lead scoring or marketing campaigns.
According to a 2025 Gartner insight, B2B organizations that align marketing and sales data effectively see up to 25% more qualified opportunities entering their pipeline compared to those with siloed systems.[1] Keeping an eye on this monthly helps sales and marketing teams adjust strategies to improve lead quality and pipeline coverage.
Track the total opportunities created each month.
When numbers fall, work with marketing to improve lead nurturing and generation efforts.
2. Pipeline Value Created: Quantifying Potential Revenue
Pipeline value created sums the estimated deal size of all new opportunities. This can be based on average deal size or projected revenue from product sales and services.
We find this metric invaluable for sales forecasting. Tracking pipeline value in real time gives sales leaders a better picture of total revenue potential. It also helps sales reps prioritize deals that will drive total sales and future revenue.
Monitor pipeline value weekly or monthly.
Use this to forecast total revenue and set realistic sales goals.
3. Pipeline Growth Rate: Measuring Momentum
Pipeline growth rate measures the percentage change in total pipeline value over a set period (week or month). It’s a telling metric for sales velocity and pipeline health.
A positive growth rate indicates a strong sales funnel that’s generating more opportunities and larger deals. A negative rate means slow sales or stalled deals. At Hyperke, we recommend sales managers track this closely to identify pipeline bottlenecks and adjust sales processes promptly.
Watch pipeline growth rate regularly.
Use the data to help sales teams focus on improving lead conversion.
Looking to accelerate your pipeline and scale faster? Explore our wholesale expansion services to build a consistent growth strategy.
4. Win Rate: Converting Opportunities into Revenue
Win rate is the percentage of total deals that sales reps close successfully. For example, if your sales team works 100 deals and closes 30, the win rate is 30%.
Win rates provide insight into sales effectiveness. We advise breaking down win rate by product or sales rep to find coaching opportunities. Better win rates mean more closed won deals and less closed lost.
Analyze win rates by sales reps and deal size.
Use insights to improve sales training and cross selling strategies.
5. Sales Pipeline Velocity: Accelerating Deal Flow
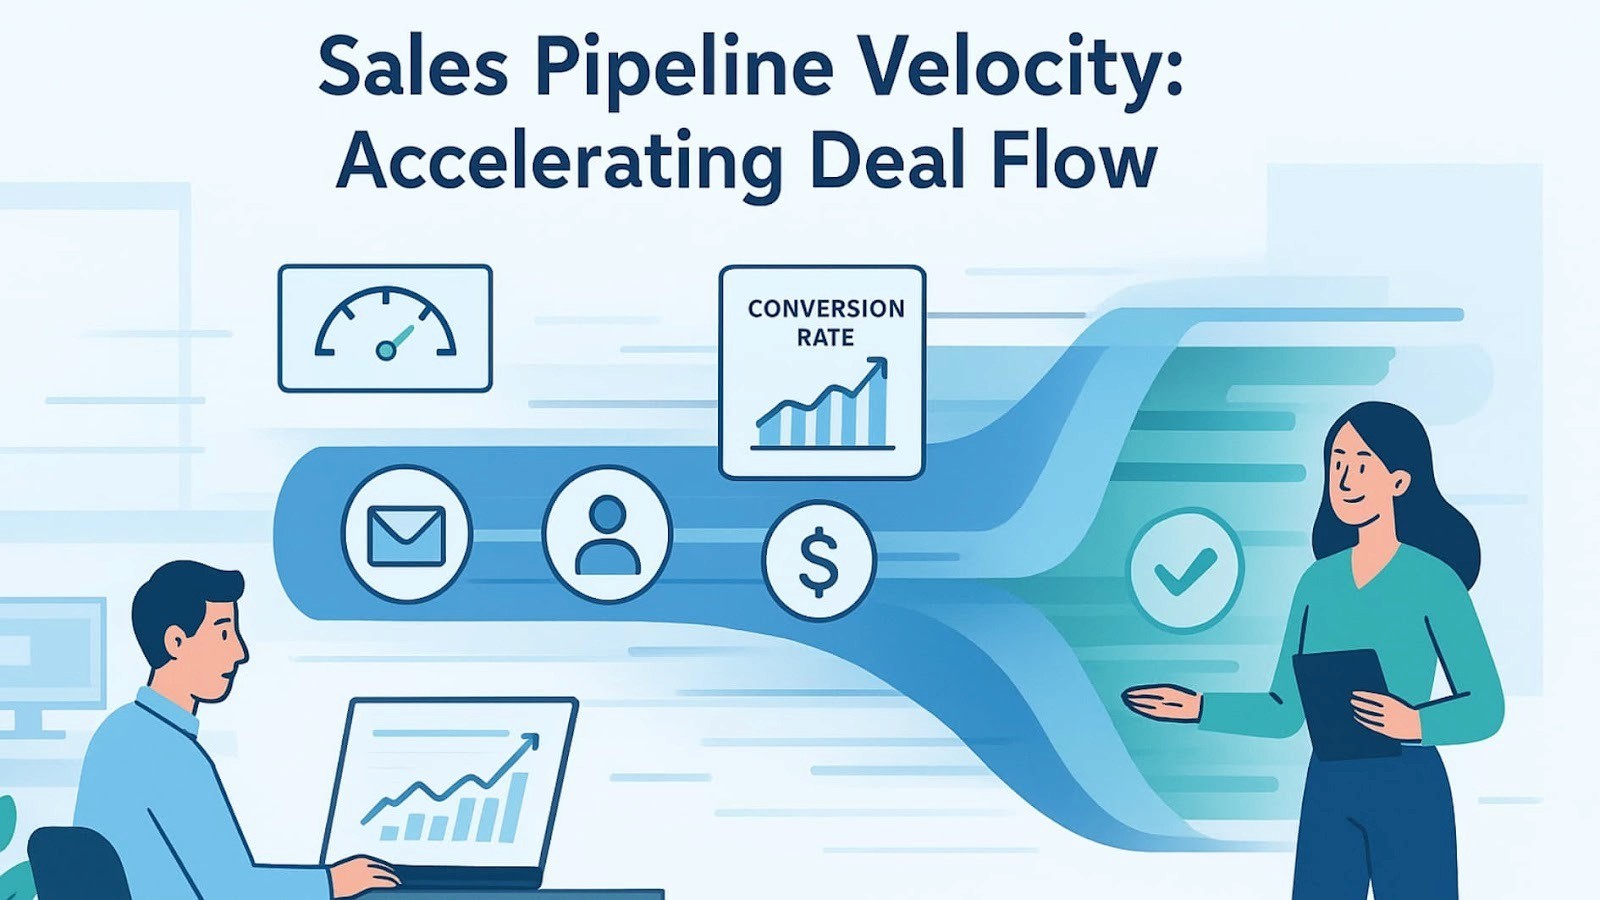
Sales pipeline velocity measures how fast deals move through the sales cycle and generate revenue. The formula is:
Velocity = (Number of Opportunities × Win Rate × Average Deal Size) ÷ Sales Cycle Length (total days)
Tracking velocity helps sales leaders spot where deals spend too long. Faster velocity means steady flow of won deals and predictable revenue growth. We encourage sales teams to focus on speeding stalled deals to move forward.
Calculate velocity monthly using pipeline data.
Fix slow sales stages to boost sales efficiency and close deals faster.
6. Conversion Rates Through Stages: Pinpointing Bottlenecks
Conversion rates track the percentage of deals that move from one pipeline stage to the next, like from lead qualification to sales qualified leads.
By analyzing conversion rates, sales leaders identify weak spots in the sales funnel. Low conversion rates at a stage means sales reps may need better support or marketing may need to improve lead quality.
Review conversion rates weekly.
Target improvements in sales process or lead nurturing where conversion dips.
7. Drop-Off by Deal Stage: Understanding Lost Opportunities
Drop-off rates show where deals disengage or go closed lost in the sales pipeline. High drop-offs at a stage can mean poor lead qualification, stalled deals, or product fit issues.
Understanding why deals are lost is crucial for improving your sales approach and reducing customer churn. Tracking drop-offs with CRM software helps, but research indicates that over 40% of B2B deals end in a “no decision” because buyers face uncertainty or can’t differentiate between vendors.[2]
Addressing these weak points early can significantly improve pipeline performance.
Track drop-off by deal stage regularly.
Investigate reasons for lost deals and adapt sales strategies.
8. Pipeline Coverage Ratio: Ensuring Sufficient Capacity
Pipeline coverage ratio compares total pipeline value to your sales quota or revenue target. A ratio of 3 means your pipeline value is three times your sales goals, which accounts for deal losses and uncertainties.
Maintaining a healthy coverage ratio is a best practice. Sales leaders should ensure pipeline coverage ratio stays above 3 to keep sales teams on track.
Maintain a pipeline coverage ratio of at least 3.
Adjust lead generation and sales efforts if ratio drops.
9. Stalled Deals: Managing Inactive Opportunities
Stalled deals are those not moving through pipeline stages for a set number of days. These deals inflate total pipeline but don’t contribute to revenue growth.
We help sales teams identify stalled deals during pipeline reviews. Reviving or removing these deals maintains pipeline health and helps sales reps focus on best sales opportunities.
Identify deals inactive for too long.
Regularly clean stalled deals to improve pipeline accuracy.
If your team needs help reactivating stalled deals or improving deal flow, book a strategy call with our lead generation team.
Practical Steps To Build A Strong Sales Pipeline
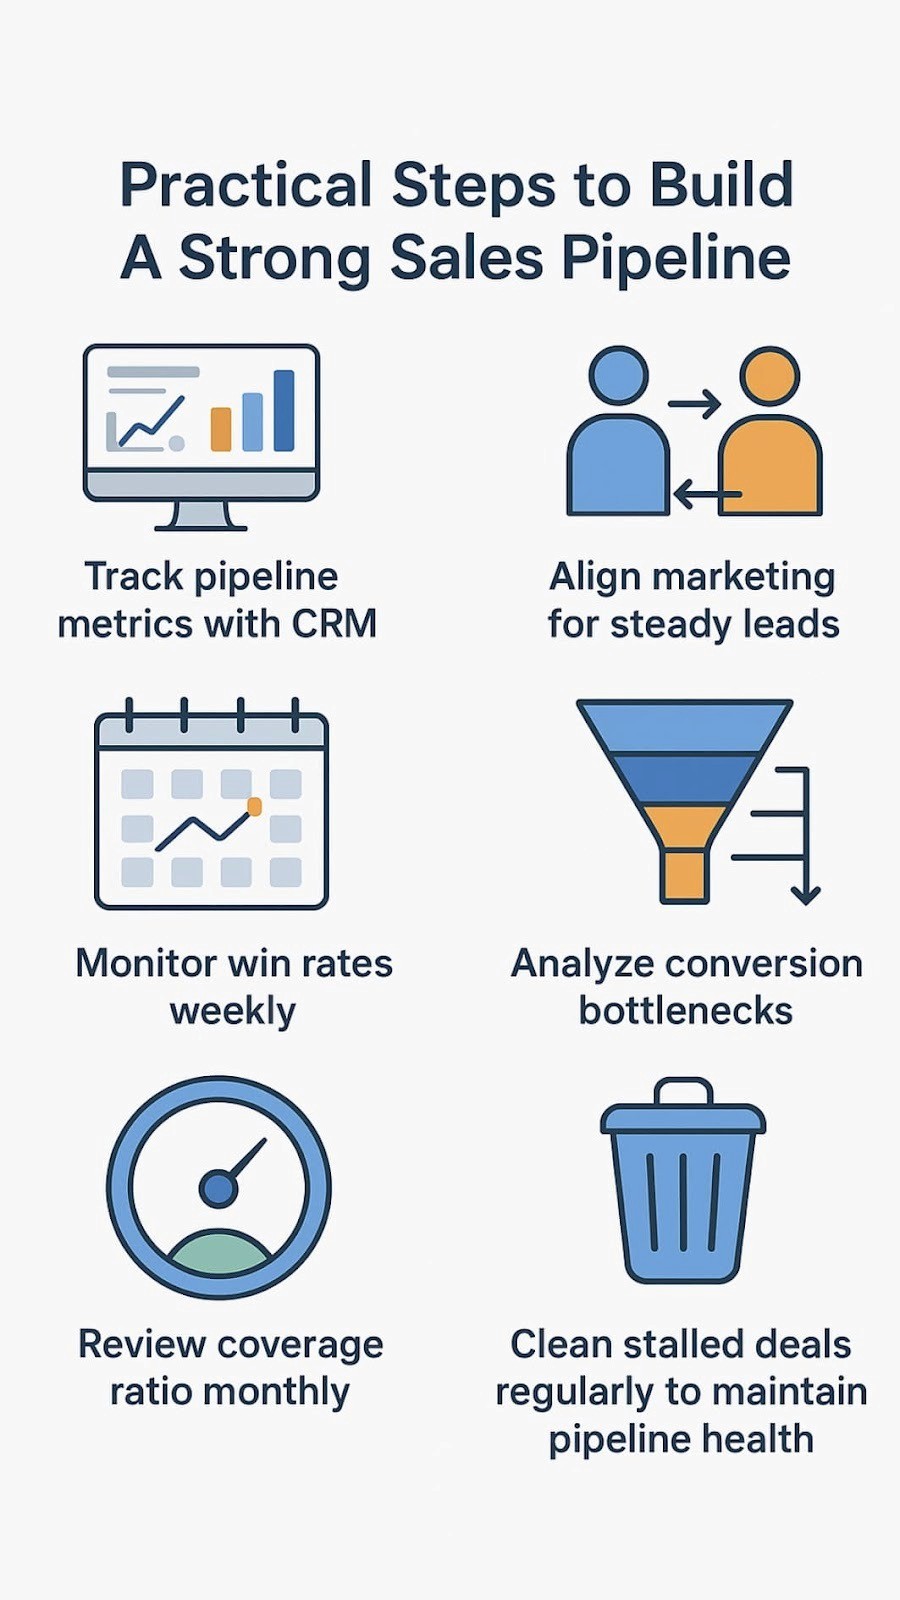
If you’ve made it this far, you likely want to improve your sales pipeline and sales growth. From our time helping B2B sales teams, here’s a simple step guide that helps sales leaders and revops teams get started::
Step 1: Use CRM software to track pipeline metrics in real time. Make sure your sales reps update deal stages and total days regularly.
Step 2: Work closely with marketing teams to improve lead generation and lead scoring so that sales qualified leads flow steadily into your pipeline.
Step 3: Monitor win rates and pipeline velocity weekly to spot slow sales or stalled deals early.
Step 4: Analyze conversion rates and drop-off points to identify bottlenecks. Provide targeted training or tools for sales reps struggling at certain pipeline stages.
Step 5: Review your pipeline coverage ratio monthly and adjust lead generation efforts or sales quotas to maintain a strong pipeline.
Step 6: Regularly clean up stalled deals to keep pipeline data accurate and help sales reps focus on deals that will close.
Key Pipeline Growth Metrics Summary
Metric | Definition | Why It Matters |
Opportunities Created | Number of new sales chances | Shows how well lead generation and marketing work |
Pipeline Value Created | Estimated dollar value of new deals | Gives a financial view of pipeline health |
Pipeline Growth Rate | Change in pipeline value over time | Shows whether pipeline is growing or shrinking |
Win Rate | Percent of opportunities that close | Measures sales rep effectiveness |
Sales Pipeline Velocity | How fast deals move through pipeline | Shows pipeline health and sales efficiency |
Conversion Rates | Percent of deals moving between stages | Finds bottlenecks in the sales process |
Drop-Off by Stage | Where deals get lost | Helps improve sales tactics and reduce churn |
Pipeline Coverage Ratio | Pipeline value vs sales target | Ensures you have enough deals to meet revenue goals |
Stalled Deals | Deals inactive too long | Distorts pipeline health and forecasting |
FAQ
How can tracking sales pipeline metrics help my sales team perform better?
From our work with B2B sales teams, we’ve seen that tracking key metrics in real time helps sales reps see how deals move through the sales funnel. When sales leaders use CRM software and pipeline analytics, they can spot slow sales, fix problems early, improve lead quality, and close more won deals for steady revenue growth.
What’s the best way to measure win rates and deal size?
We measure win rates and average deal size by looking at total closed deals, total revenue, and sales cycle length. This stage helps sales leaders and revops teams understand how long it takes to close deals. When we track this pipeline data often, we make better choices about lead scoring and reach our revenue goals faster.
How do stalled deals and pipeline coverage ratio affect sales growth?
Stalled deals can slow down the sales process and hurt pipeline health. A strong pipeline needs a steady flow of qualified leads and a good pipeline coverage ratio. From our experience, checking how many total days deals spend in each pipeline stage helps sales managers fix slow sales and improve future revenue.
How can sales leaders use conversion rates to build a strong pipeline?
Conversion rates show how well sales reps move deals from one stage of the sales cycle to the next. We’ve seen that better lead nurturing and qualification process improve lead conversion and lower the churn rate. When marketing teams and sales reps work together, it helps sales create qualified leads and future sales.
What best practices help sales teams close more deals and hit revenue goals?
Good sales pipeline management means tracking total opportunities, win rate, and number of deals in real time. Sales managers and revops teams use these key indicators to guide sales reps and make better decisions. When everyone works together to help sales move forward, the team closes more deals and builds a strong sales funnel that drives business growth.
Conclusion
Tracking the right key metrics pipeline growth gives sales leaders and sales teams a clear view of pipeline health, sales velocity, and conversion rates. When sales reps pay attention to win rates, stalled deals, and pipeline coverage, they can fix slow sales, reduce churn rate, and close more total deals. These insights help your team make better decisions and improve future sales.
Ready to build a strong sales pipeline and drive revenue growth? Book a demo with Hyperke today.
References
https://www.gartner.com/en/insights/sales/
https://www.sharpstance.com/blog/why-b2b-deals-end-in-no-decision/
Related Articles
Still uncertain?
FAQs
How much does a cold email agency cost?
How long does it take for cold email campaigns to generate leads?
What's the difference between cold email leads and booked appointments?
How many cold emails can you send per month for my business?
How do cold email agencies avoid spam filters and deliverability issues?
Does cold email and cold calling still work in 2026?
How is your outbound system different from hiring an in-house SDR?
What industries does cold email work best for?
Do you work on a pay-per-lead basis?